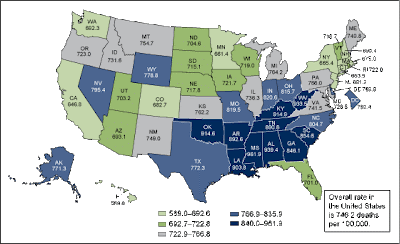
The report states:
"States experience different risks of mortality. Hawaii has the lowest age-adjusted death rate (589.6 deaths per 100,000 population) of all the states, 21.0 percent lower than the rate for the United States (746.2). Mississippi had the highest age-adjusted death rate in 2010 (961.9), 28.9 percent higher than the U.S. rate."
"In general, states in the southeast region have higher rates than those in other regions of the country. Louisiana, for example, is typical of the region and has an age-adjusted death rate of 903.8 deaths per 100,000 population."
And the leading causes of death? The top five are: unintentional injury, homicide, suicide, cancer, and heart disease. How do the causes vary by age? See the graph below (from the report - click to enlarge).
Key findings from the report are:
- Life expectancy at birth is 78.7 years. Hispanic females have the longest life expectancy (83.8 years) followed by non-Hispanic white females (81.1 years).
- The largest decrease in mortality between the years 2000 and 2010 occurred in the age group under age 25 years (15.8 percent), followed by those aged 65 years and over (13.3 percent).
- States in the southeast region generally have higher death rates than those in other regions of the country.
- In 2010, the five leading causes of death were: heart disease, cancer, chronic lower respiratory diseases, stroke, and accidents. The ranking of conditions varies according to demographics such as age, sex, and race.
- The infant mortality rate reached a record-low level of 6.14 infant deaths per 1,000 live births in 2010.


No comments:
Post a Comment