The Capital Spectator (see here) has a post on what sounds like a very useful new book about retirement planning, The 7 Most Important Equations for Your Retirement by Moshe Milevsky. The Spectator says,
"It's also time to start doing the math. Milevsky, a professor at York
University who's written extensively on retirement planning, takes the
reader on a brief but revealing tour through seven equations that he
argues (persuasively) that are essential for answering such questions
as: How long will my nest egg hold out? How long is my retirement likely
to last? How should I structure my spending plans in retirement? What
is the probability that my retirement plan is sustainable."
I've put the book on my "to read" list.
Tuesday, May 29, 2012
March Case-Shiller Housing Index
Calculated Risk (see here) provides us with an updated graph of the March Case-Shiller Housing Index.

Phil Izzo at the Wall Street Journal (see here) talks about the results. He says,
"Thirteen of the 20 cities posted annual declines in March, but Phoenix, Minneapolis, Denver, Miami, Detroit, Dallas and Charlotte notched gains. On a seasonally adjusted basis, which aims to take into account the slower selling season in the winter, things looked a little better. The overall 20-city index was up 0.1% from the previous month, and just four cities posted monthly declines."
2012 Milliman Medical Index
In a report about the cost of health care (the 2012 Milliman Medical Index, see here), there is the following (very interesting graph).

Uwe Reinhart (see here) has a post about the report in which he says:
"The virtue of this index lies in its inclusion of out-of-pocket spending in total health spending. Just tracking premiums for employment-based health can be misleading, if employers shift more and more of the cost of health care out of their benefit package into deductibles or coinsurance paid by employees, exclude certain benefits altogether or otherwise limit coverage."
"For 2012, the nationwide average of the total health spending for a typical family of four was estimated by Milliman to be $20,728. On a regional basis, that average varies from a low of $18,365 in Phoenix to $24,965 in Miami."
Reinhart has the following chart in his post:

He makes the following (important) observation:
"Americans are fond of the idea that individuals and families should be self-reliant. But a question confronting the American public and their political representatives is how they imagine households with money income of, say, $30,000 to $50,000 will tolerate the ever-larger bites the health care Pacman seeks to take out of their budgets."
Thursday, May 24, 2012
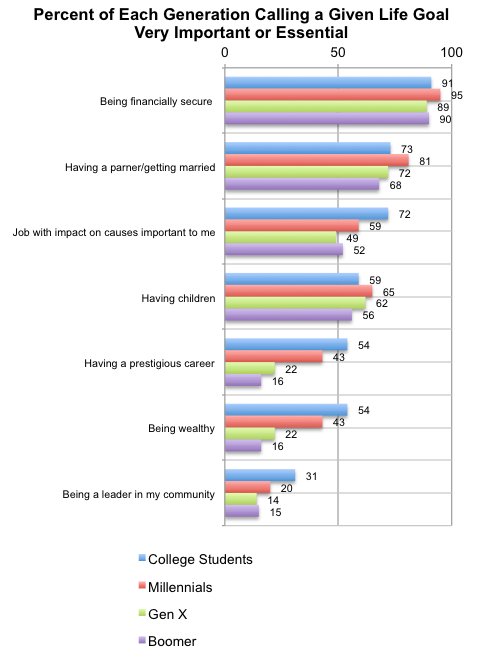
New survey on the importance of financial security
Catherine Rampell over at the New York Times (see here) reports today on a new survey that addresses how different generations compare on their ranking of "life goals." Interesting reading.

She does point out the following: "This is the first time the Heldrich Center asked these specific questions, so it’s hard to know to what extent these generational differences are due to aging, current (and eventually passing) economic conditions or something culturally specific to each age cohort."
She does point out the following: "This is the first time the Heldrich Center asked these specific questions, so it’s hard to know to what extent these generational differences are due to aging, current (and eventually passing) economic conditions or something culturally specific to each age cohort."
Wednesday, May 23, 2012
When the student becomes a customer, ....
A story in the Washington Post (see here) highlights some recent data on the number of hours that students study each week while in college.

The story reports the following comparison: "Over the past half-century, the amount of time college students actually study — read, write and otherwise prepare for class — has dwindled from 24 hours a week to about 15, survey data show." The report is likely to elicit a big yawn from most people and that's too bad. I've been a college professor now for about 15 years and my experience is very consistent with the results of the study. And, yes, there are lots of reasons (several mentioned in the study). The one at the top of my list is the insistence that students be viewed as "customers." When students become customers, these customers tend to see themselves less and less as students (that is, as people who have voluntarily submitted to a chosen course of study that demands engagement and significant time).

The story reports the following comparison: "Over the past half-century, the amount of time college students actually study — read, write and otherwise prepare for class — has dwindled from 24 hours a week to about 15, survey data show." The report is likely to elicit a big yawn from most people and that's too bad. I've been a college professor now for about 15 years and my experience is very consistent with the results of the study. And, yes, there are lots of reasons (several mentioned in the study). The one at the top of my list is the insistence that students be viewed as "customers." When students become customers, these customers tend to see themselves less and less as students (that is, as people who have voluntarily submitted to a chosen course of study that demands engagement and significant time).
Tuesday, May 22, 2012
A good gig, if you can get it...
"The report from Good Jobs First, a nonprofit taxpayer watchdog
organization funded by Ford, Surdna and other major foundations,
identifies 16 states that let companies divert some or all of the state
income taxes deducted from workers’ paychecks. None of the states
requires notifying the workers, whose withholdings are treated as taxes
they paid." (see here) Well, information that starts out like this isn't likely to be ... encouraging. And it isn't.

And even closer to home, see the graph below.


And even closer to home, see the graph below.

Can "the market" fix everything?
Before you answer that question, I highly recommend a visit to the Boston Review Forum on "How Markets Crowd Out Morals" (see here). It will be worth your time.
Some more wise advice from Alan Blinder
Yes, Alan Blinder is one of those people I consider wise. He says (see here):
"So here, in brief, is my three-step rehab program for our nation's fiscal policy. First, enact a modest stimulus, sharply targeted on job creation—and avoid falling off the fiscal cliff. Second, once the economy is ready, start on something that resembles the 10-year Simpson-Bowles deficit-reduction plan—which would pay for the stimulus 15-20 times over. Third, figure out how to bend the health-care cost curve downward."
(from Wall Street Journal, May 21, 2012)
Monday, May 21, 2012
No, I didn't make this up...
The New York Times is reporting (see here) that House Republicans have passed a bill (sponsored by Daniel Webster, R, Florida) that would eliminate the government survey known as the American Community Survey - one of the most important information gathering instruments of the entire U.S. government. It provides us with some of the most useful information we have about our nation. And what was Mr. Webster's argument for eliminating it. No, I'm not making this up. He said:
“This is a program that intrudes on people’s lives, just like the Environmental Protection Agency or the bank regulators,” and “We’re spending $70 per person to fill this out. That’s just not cost
effective,” he continued, “especially since in the end this is not a
scientific survey. It’s a random survey.”
So we have an elected member of the House who wants to eliminate work done by a very accomplished group of economists and statisticians and his basic argument is that it isn't scientific because its random. Never-mind that the first requirement of a "scientific survey" is that it protects against bias by using randomness. Help, somebody....anybody.
Saturday, May 19, 2012
News not getting better for college grads
A recent Los Angeles Times article (see here) highlights some data from the Economic Policy Institute (see here) that isn't encouraging for college graduates.

The authors state: "The wages of young college graduates have fared poorly during the Great Recession and its aftermath. Between 2007 and 2011, the wages of young college graduates dropped 4.6 percent (5.1 percent for men and 4.1 percent for women). As the figure shows, however, the wage growth of young graduates was weak even before the Great Recession began; they have fared poorly over the entire period of general wage stagnation that began during the business cycle of 2000–2007. Between 2000 and 2011, the wages of young college graduates dropped 5.4 percent (1.6 percent for men and 8.5 percent for women)."
Moreover, Mark Perry at the blog Carpe Diem (see here) shows the increasing cost of higher education, relative to price increases in the rest of the economy.

He states: "The CPI for college tuition has increased almost 12 times since 1978, compared to the 3.5 time increase in overall consumer prices, and the 4.4 time increase in home prices at their "bubble peak." What the two bubbles have in common is that they have both been fueled by political obsessions: one with home ownership and another with college education."
Finally, Phil Izzo over at the Wall Street Journal (see here) calls this a student loan "bubble" and it makes his "Number of the Week."

He states: "368%: The jump since 2007 in the measure of consumer credit held by the government comprised primarily of student loans. If a student loan bubble were to pop, the government, not private banks, would be the one standing around with gum in its hair." And, "The bulk of any burden from a student-loan debt bubble bursting is likely to fall on the borrowers themselves. While that means the broader economy can avoid a systemic crisis, it will struggle with a younger generation whose spending power is constrained limiting growth for years."
Thursday, May 17, 2012
Population data from the Wall Street Journal
The Wall Street Journal (see here) has a graphic summarizing the latest census data on minorities and the U.S. population. According to the Journal, "William H. Frey, a demographer at the Brookings Institution, says
African-Americans are the largest minority among adults over 50. But for
anyone younger—including the newborns forming America's first "majority
minority" generation—Hispanics are the second-largest population group
after whites of European descent."

Also the Journal reports (see here) "large generational differences." In Mississippi there are several counties for which there is a big difference between "Total % White" and the "Under Age 5 % White."


Also the Journal reports (see here) "large generational differences." In Mississippi there are several counties for which there is a big difference between "Total % White" and the "Under Age 5 % White."

Maybe some good news for pensions
Over at the Center on Budget and Policy Priorities (see here), they may have some good news for pensions. According to the post, "The stock market’s rebound from its depths in the recession has lifted
pension assets substantially over the past two and half years, Federal
Reserve data show."
 Some of this improvement is due to structural changes in the pension policies. The National Conference of State Legislatures (see here) reports as follows:
"From 2009 through 2011, 43 states enacted major changes in state retirement plans for broad categories of public employees and teachers to address long-term funding issues. Their changes were designed to reduce pension fund obligations by increasing employee contributions or age and service requirements for retirement, or both, and adjusting benefit provisions in various other ways that reduce costs. Such legislation was rare before 2005, but became national in scope from 2009 on. Ten states made such changes in 2009; 21 did so in 2010 and 32 did so in 2011. Several states acted more than once, for a total of 43 states over the three years. "

"From 2009 through 2011, 43 states enacted major changes in state retirement plans for broad categories of public employees and teachers to address long-term funding issues. Their changes were designed to reduce pension fund obligations by increasing employee contributions or age and service requirements for retirement, or both, and adjusting benefit provisions in various other ways that reduce costs. Such legislation was rare before 2005, but became national in scope from 2009 on. Ten states made such changes in 2009; 21 did so in 2010 and 32 did so in 2011. Several states acted more than once, for a total of 43 states over the three years. "
Wednesday, May 16, 2012

Student loan debt - Graduate Degrees
The Wall Street Journal - Smart Money - (see here) has more data on student loan debt for students obtaining graduate degrees:


Sunday, May 6, 2012
Graphic on student loan debt
A very informative graphic on student loan debt from AP. Click on graphic to enlarge.


Unemployment among the young
This recession has been particularly unkind to the young seeking employment. As EPI demonstrates (see here). Click on graph to enlarge.
Unemployment and underemployment rates of young graduates have only modestly improved since their peak in 2010.

Unemployment and underemployment rates of young graduates have only modestly improved since their peak in 2010.
- For young high school graduates, the unemployment rate was 32.7 percent in 2010 and 31.1 percent over the last year (April 2011–March 2012), while the underemployment rate was 55.9 percent in 2010 and 54.0 percent over the last year.
- For young college graduates, the unemployment rate was 10.4 percent in 2010 and 9.4 percent over the last year, while the underemployment rate was 19.8 percent in 2010 and 19.1 percent over the last year.

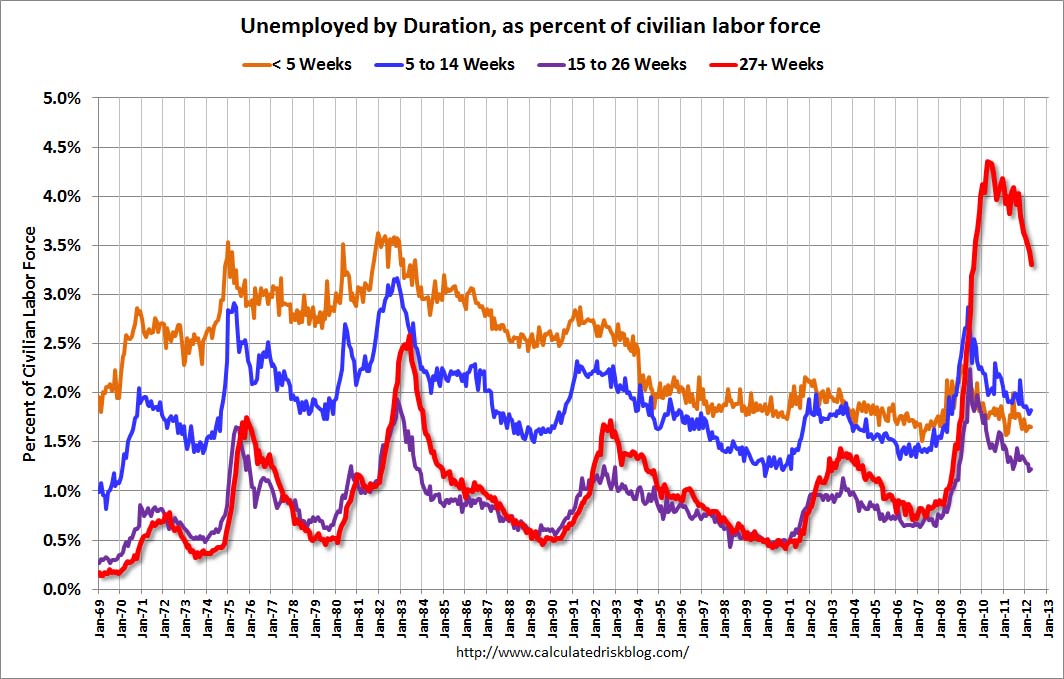
The long road back to employment
Calculated Risk (see here) has another informative chart for us - clearly showing us one way in which this recession has been quite different. Click on the graph to enlarge.

Subscribe to:
Posts (Atom)