
Sunday, May 6, 2012
Graphic on student loan debt
A very informative graphic on student loan debt from AP. Click on graphic to enlarge.

Unemployment among the young
This recession has been particularly unkind to the young seeking employment. As EPI demonstrates (see here). Click on graph to enlarge.
Unemployment and underemployment rates of young graduates have only modestly improved since their peak in 2010.

Unemployment and underemployment rates of young graduates have only modestly improved since their peak in 2010.
- For young high school graduates, the unemployment rate was 32.7 percent in 2010 and 31.1 percent over the last year (April 2011–March 2012), while the underemployment rate was 55.9 percent in 2010 and 54.0 percent over the last year.
- For young college graduates, the unemployment rate was 10.4 percent in 2010 and 9.4 percent over the last year, while the underemployment rate was 19.8 percent in 2010 and 19.1 percent over the last year.

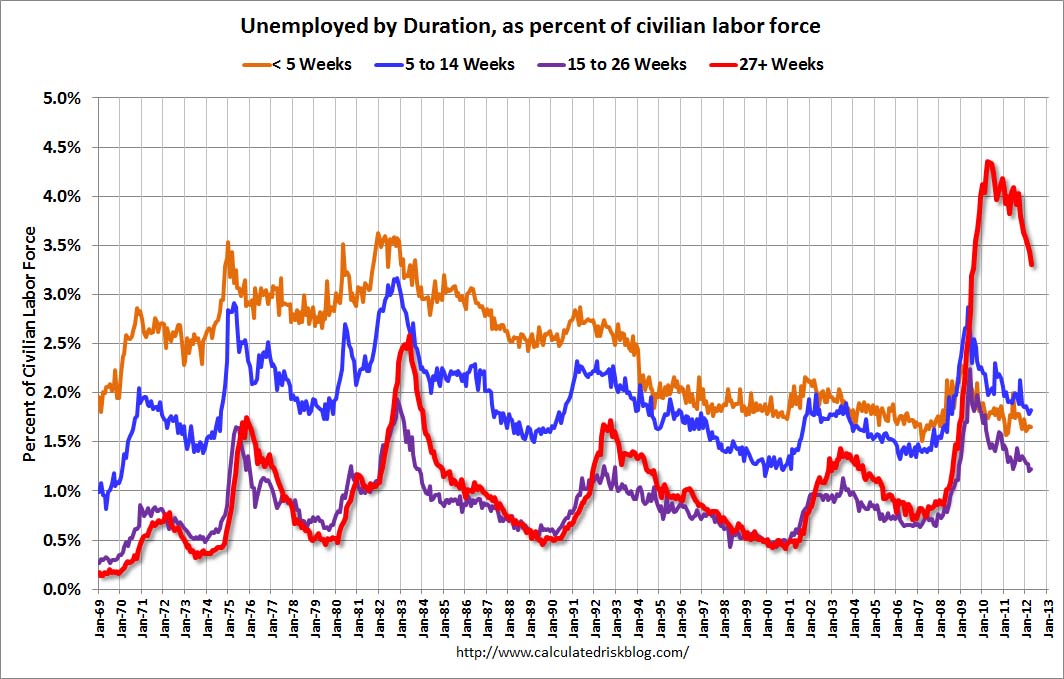
The long road back to employment
Calculated Risk (see here) has another informative chart for us - clearly showing us one way in which this recession has been quite different. Click on the graph to enlarge.

Monday, April 30, 2012
Student loans....
There is much to say about the debate/discussion currently taking place regarding student loan debt. I'll say more in a later post, but for now, let's take a look at some data Mike Konczal has over at his new blog (see here).

So the first fact that we should recognize is this: students are borrowing a much higher percentage of the total cost of college as a result of the significant reduction in state and federal support (read grants!). I'm making no evaluation of this fact yet, but it needs to be recognized by anyone engaged in a discussion about student loan debt.

So the first fact that we should recognize is this: students are borrowing a much higher percentage of the total cost of college as a result of the significant reduction in state and federal support (read grants!). I'm making no evaluation of this fact yet, but it needs to be recognized by anyone engaged in a discussion about student loan debt.
Friday, April 20, 2012


Thursday, April 5, 2012
Philadelphia Fed sees state economies improving
The Philadelphia Fed's (see here) February 2012 leading economic indicators shows improving economies in most states (see map below).


The housing problem continues
The housing problem continues to haunt the economy (see graph below from CoreLogic). Jared Bernstein notes the following (see here):
A key variable here is the share of total sales that are distressed. As the figure below shows, that share was falling a few months ago, but it’s started growing again, and as long as a) it’s growing and b) the price of distressed sales is falling, the national price will continue to fall and we’ll be doing slightly worse than bumping along the bottom.

Subscribe to:
Posts (Atom)